Article content
The measurement paradox
60% of managers admit they need better KPIs for AI. Only 34% are doing anything about it. Meanwhile, the data that actually matters already exists, but nobody’s looking at it.
TL;DR: Companies measure activity (hours saved, tasks automated) instead of impact. A Stanford paper analyzing 25 million workers shows what to do instead: segment by role and seniority, distinguish substitutive from augmentative use, use control groups, monitor in real time. Those who adopt these principles will have an information advantage over those still tracking vanity metrics.
The 2025 AI adoption reports tell a strange story. On one hand, companies claim to measure everything: completed deployments, hours saved, tickets handled, costs reduced. On the other, 42% are abandoning most of their AI projects, more than double the previous year. According to MIT NANDA, 95% of pilot projects generate no measurable impact on the bottom line.
If we measure so much, why do we fail so often?
The problem is we’re measuring the wrong things. Typical enterprise AI metrics (time saved per task, volume of automated interactions, cost per query) capture activity, not impact. They tell you whether the system works technically, not whether it’s creating or destroying value.
A paper published in August 2025 by Stanford’s Digital Economy Lab offers a different approach to what it means to truly measure AI. And the implications for those managing technology investments are concrete.
The vanity metrics problem
Most corporate AI dashboards track variants of the same metrics: how many requests processed, how much time saved per interaction, what percentage of tasks automated. These are numbers that grow easily and look good in slides. Their flaw is fundamental: they say nothing about real business impact.
A chatbot handling 10,000 tickets per month looks like a success. But if those tickets still require human escalation 40% of the time, if customer satisfaction has dropped, if your most profitable customers are migrating to competitors, the number of tickets handled captures none of this.
The S&P Global 2025 report documents exactly this pattern: companies that accumulated “deployments” and “completed experiments” only to discover, months later, that ROI wasn’t materializing. Costs were real and immediate; benefits were vague and perpetually deferred to next quarter.
According to an MIT Sloan analysis, 60% of managers recognize they need better KPIs for AI. But only 34% are actually using AI to create new performance indicators. The majority continues using the same metrics they used for traditional IT projects, metrics designed for deterministic software, not for probabilistic systems interacting with complex human processes.
What serious measurement looks like
“Canaries in the Coal Mine”, the paper by Erik Brynjolfsson, Bharat Chandar, and Ruyu Chen published by Stanford’s Digital Economy Lab, isn’t about how companies should measure AI. It’s about how AI is changing the labor market. But the method it uses is exactly what’s missing from most enterprise evaluations.
The authors obtained access to ADP payroll data, the largest payroll processor in the United States, with monthly records of over 25 million workers. Not surveys, not self-reports, not estimates: granular administrative data on who gets hired, who leaves, how much they earn, in which role, at which company.
They then cross-referenced this data with two AI exposure metrics: one based on theoretical task analysis (which jobs are technically automatable) and one based on actual usage data (how people actually use Claude, Anthropic’s model, in daily work).
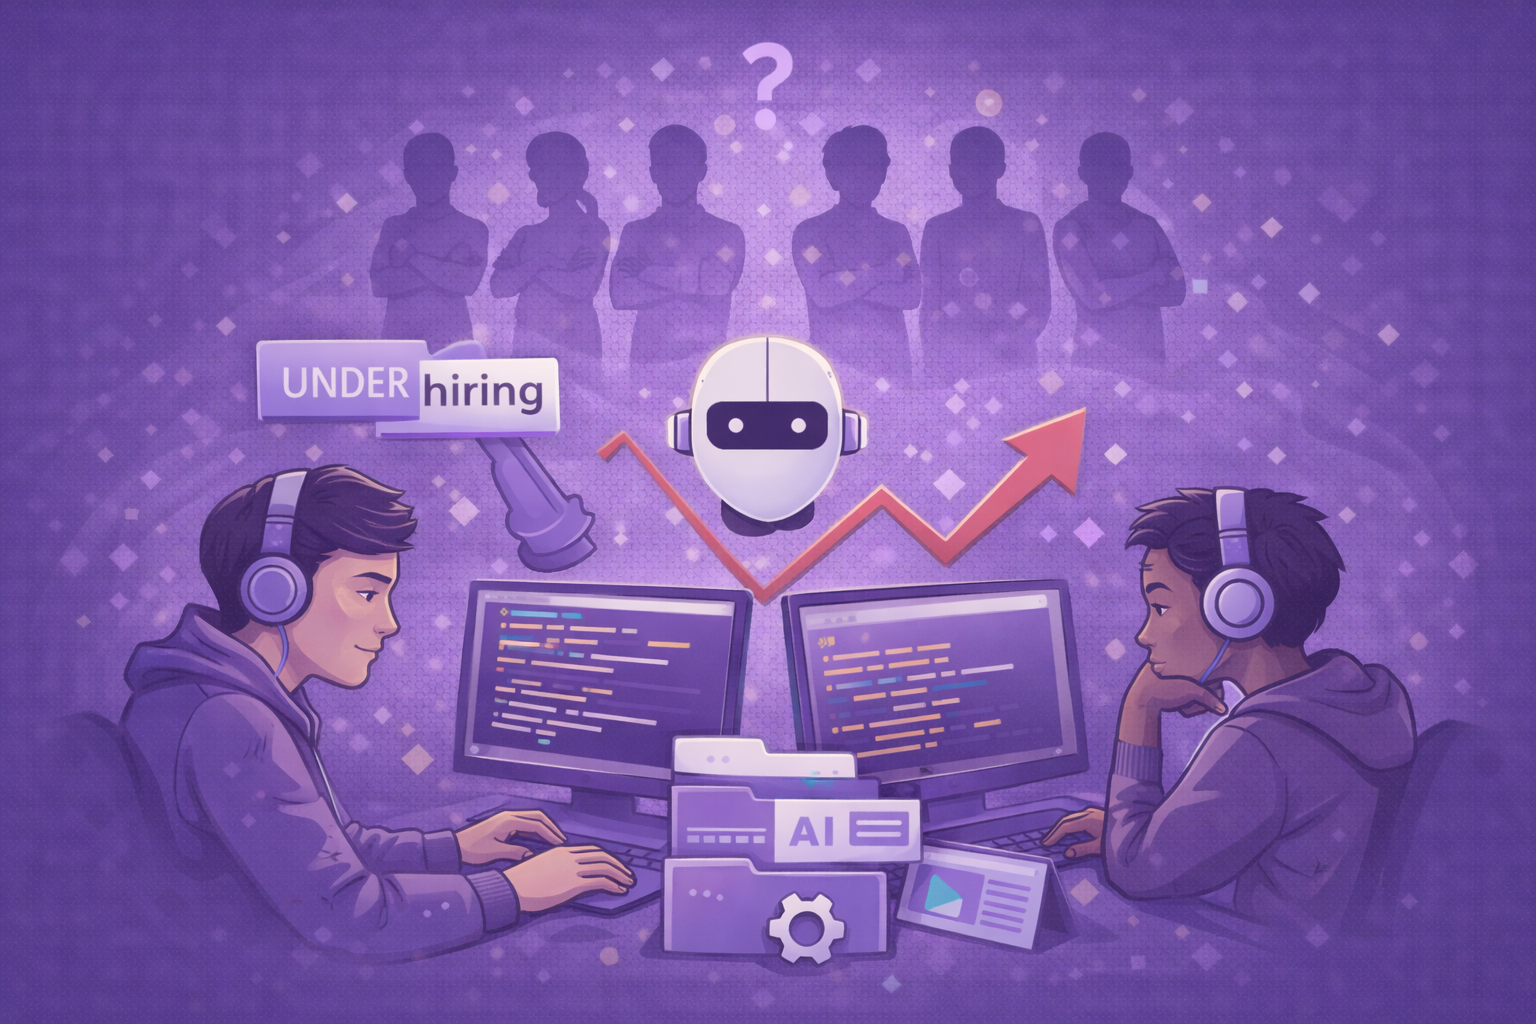
The result is an X-ray of AI’s impact with unprecedented granularity. Not the generic “AI is changing work” but precise numbers: employment for software developers aged 22-25 dropped 20% from the late 2022 peak, while for those over 35 in the same roles it grew 8%. In professions where AI use is predominantly substitutive, young workers lose employment; where it’s predominantly augmentative, there’s no decline.
This type of measurement should inform corporate AI decisions. Not because companies need to replicate this exact study, but because it illustrates three principles that most enterprise metrics ignore entirely.
Measure differential effects, not averages
Aggregate data hides more than it reveals. If you only measure “hours saved by AI,” you don’t see who’s saving those hours and who’s losing their job. If you only measure “tickets automated,” you don’t see which customers are receiving worse service.
The Stanford paper shows that AI’s impact differs radically by age group. Workers aged 22-25 in exposed professions saw a 13% employment decline relative to colleagues in less exposed roles. Workers over 30 in the same professions saw growth. The average effect is nearly zero, but the real effect is massive redistribution.
For a CFO, aggregate productivity metrics can mask hidden costs. If AI is increasing output from the senior team while making it impossible to hire and train juniors, the short-term gain could transform into a talent pipeline problem in the medium term. The paper calls it the “apprenticeship paradox”: companies stop hiring entry-level workers because AI handles those tasks better, but without entry-level today there won’t be seniors tomorrow.
The operational consequence is that every AI dashboard should segment impact by role, seniority, team, and customer type. A single “productivity” number is almost always misleading.
Distinguish substitutive from augmentative use
One of the paper’s most relevant findings concerns the difference between substitutive and augmentative AI use. The authors used Anthropic’s data to classify how people actually use language models: to generate final outputs (substitution) or to iterate, learn, and validate (augmentation).
In professions where use is predominantly substitutive, youth employment has collapsed. Where use is predominantly augmentative, there’s no decline; in fact, some of these categories show above-average growth.
Not all “deployments” are equal. A system that automatically generates financial reports substitutes human labor differently from one that helps analysts explore scenarios. Metrics should capture this distinction: classify each AI application as predominantly substitutive or augmentative, separately track impact on headcount, skill mix, and internal training capacity. Augmentative systems might have less immediate ROI but more sustainable effects.
Control for external shocks
One of the Stanford paper’s most sophisticated methodological aspects is its use of firm-time fixed effects. In practice, the authors compare workers within the same company in the same month, thus isolating the AI exposure effect from any other factor affecting the company: budget cuts, sector slowdown, strategy changes.
The result: even controlling for all these factors, young workers in AI-exposed roles show a relative decline of 16% compared to colleagues in non-exposed roles at the same company.
This kind of rigor is rare in corporate evaluations. When an AI project launches and costs drop, it’s easy to credit the AI. But maybe costs would have dropped anyway due to seasonal factors. Maybe the team was already optimizing before the launch. Maybe the comparison is with an anomalous period.
The solution is to define baselines and control groups before launch. Don’t compare “before vs after” but “treated vs untreated” in the same period. Use A/B tests where possible, or at least comparisons with teams, regions, or segments that haven’t adopted AI.
Toward high-frequency economic dashboards
In his predictions for 2026, Brynjolfsson proposed the idea of “AI economic dashboards”, tools that track AI’s economic impact in near real-time, updated monthly instead of with the typical delays of official statistics.
It’s an ambitious proposal at the macro level. But the underlying logic is applicable at the company level: stop waiting for quarterly reports to understand if AI is working and instead build continuous monitoring systems that capture effects as they emerge.
Most AI projects are evaluated like traditional investments: ex-ante business case, periodic reviews, final post-mortem. But AI doesn’t behave like a traditional asset. Its effects are distributed, emergent, often unexpected. A continuous monitoring system can catch drift before it becomes a problem.
In practice, this means working with real-time data instead of retrospective data. If the payroll system can tell you today how many people were hired yesterday in each role, you can track AI’s effect on headcount with a lag of days, not months. The same applies to tickets handled, sales closed, errors detected.
Another key principle: favor leading metrics over lagging ones. The actual utilization rate (how many employees actually use the AI tool every day) is a leading indicator. If it drops, there are problems before they show up in productivity numbers.
As the Stanford paper segments by age, corporate dashboards should segment by role, tenure, and prior performance. AI might help top performers while harming others, or vice versa.
Internal comparisons are also essential: teams that adopted AI vs teams that didn’t, periods with the feature active vs periods with it deactivated. These comparisons are more informative than pure time trends.
The cost of not measuring
There’s a direct economic argument for investing in better measurement. The 42% of companies that abandoned AI projects in 2025 spent budget, time, and management attention only to get nothing. With better metrics, some of those projects would have been stopped earlier. Others would have been corrected mid-course. Others still would never have started.
The MIT NANDA report estimates that companies are spending $30-40 billion per year on generative AI. If 95% generates no measurable ROI, we’re talking about tens of billions burned. Not because the technology doesn’t work, but because it’s applied poorly, measured worse, and therefore never corrected.
The Brynjolfsson paper offers a model of what AI measurement could be. Administrative data instead of surveys. Demographic granularity instead of aggregate averages. Rigorous controls instead of naive comparisons. Continuous monitoring instead of point-in-time evaluations.
No company has Stanford’s resources or access to ADP’s data. But the principles are transferable: segment, distinguish substitutive from augmentative use, control for confounding factors, monitor in real time. Those who adopt these principles will have an information advantage over those who continue tracking deployments and hours saved.
Sources
Brynjolfsson, E., Chandar, B., & Chen, R. (2025). Canaries in the Coal Mine: Six Facts about the Recent Employment Effects of AI. Stanford Digital Economy Lab.
Deloitte AI Institute. (2025). State of Generative AI in the Enterprise. Deloitte.
MIT Project NANDA. (2025). The GenAI Divide 2025. Massachusetts Institute of Technology.
MIT Sloan Management Review. (2024). The Future of Strategic Measurement: Enhancing KPIs With AI. MIT Sloan.
S&P Global Market Intelligence. (2025, October). Generative AI Shows Rapid Growth but Yields Mixed Results. S&P Global.